Navigation
What is Deep-PLA
Deep-PLA is a web server based on deep learning to predict enzyme-specific acetylation regulation. Given a protein or a set of proteins in FASTA format, it can predict the possible acetylation sites by several HATs and HDACs, including CREBBP, EP300, HAT1, KAT2A, KAT2B, KAT5, KAT8, HDAC1, HDAC2, HDAC3, HDAC6, SIRT1, SIRT2, SIRT3, SIRT6, and SIRT7. Deep-PLA adopted four feature extraction methods to extract the sequence information and used a deep neural network to learn them, in the meanwhile, PSO (particle swarm optimizer) algorithm was used to fine turn the hyperparameters such as learning rate, layer numbers, activation functions and so on. Deep-PLA performed better than previous predictors for HAT/HDAC-specific acetylation.
About predicting performance
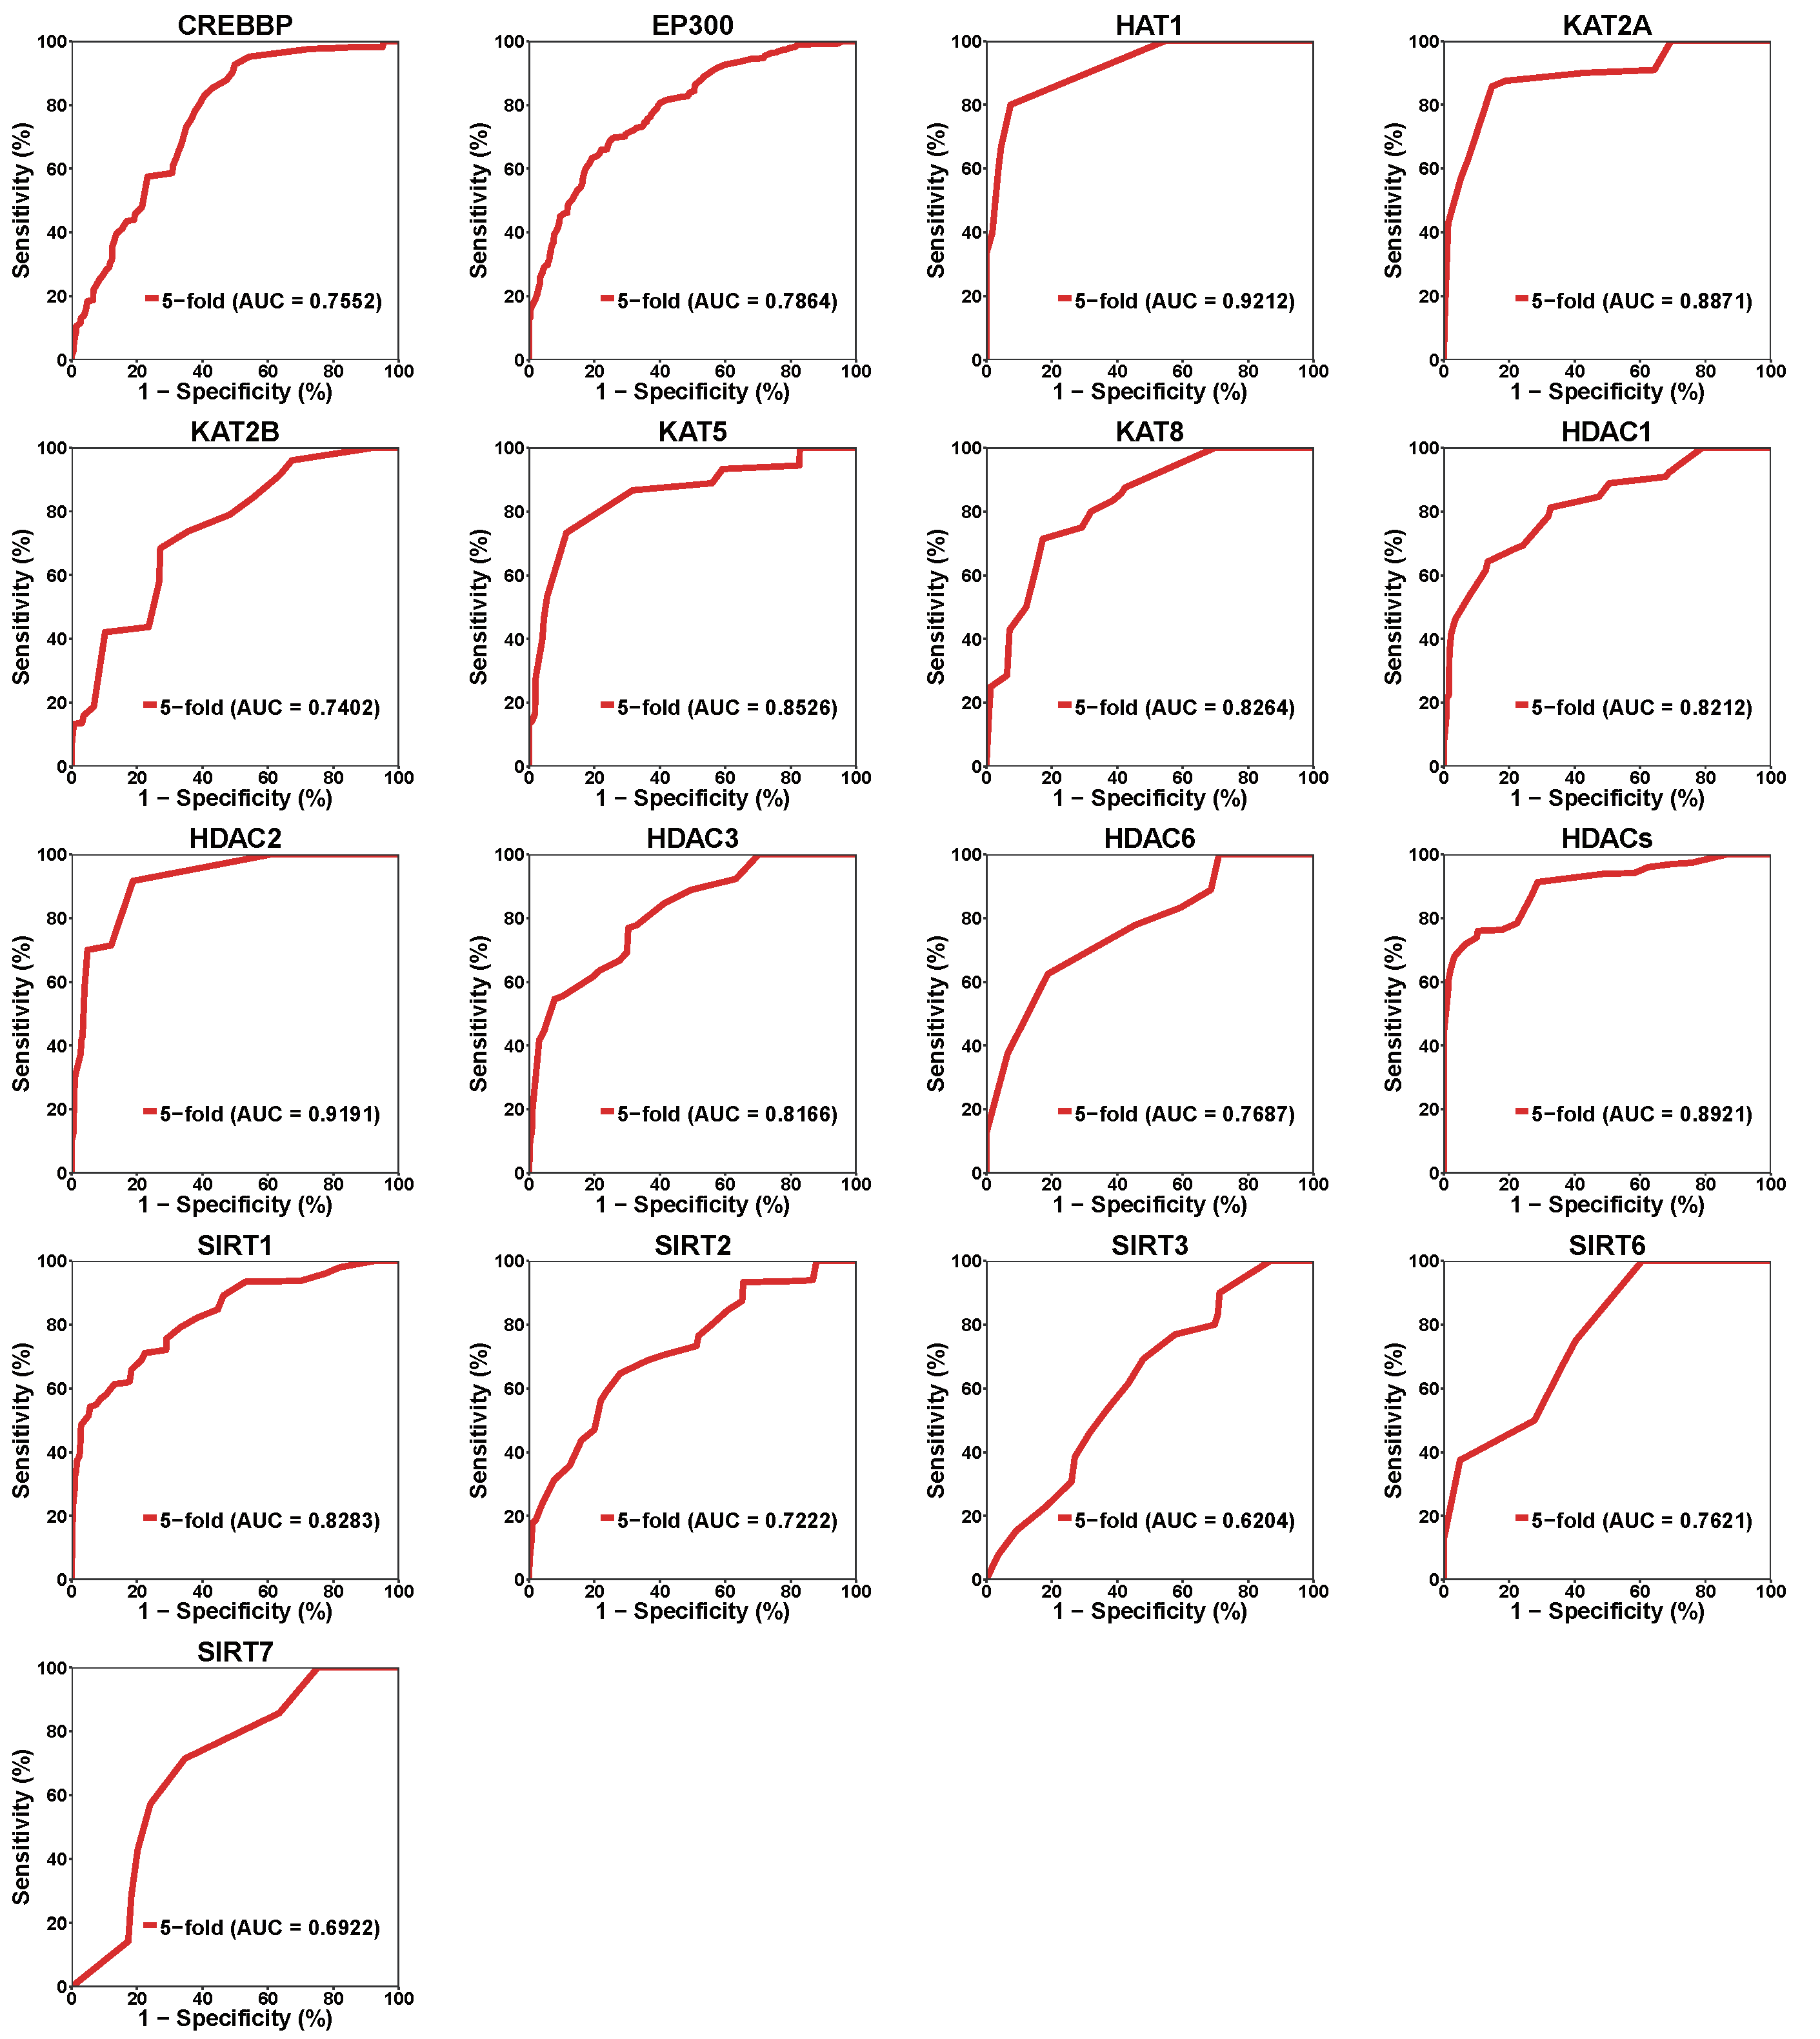
ROC for cross validation
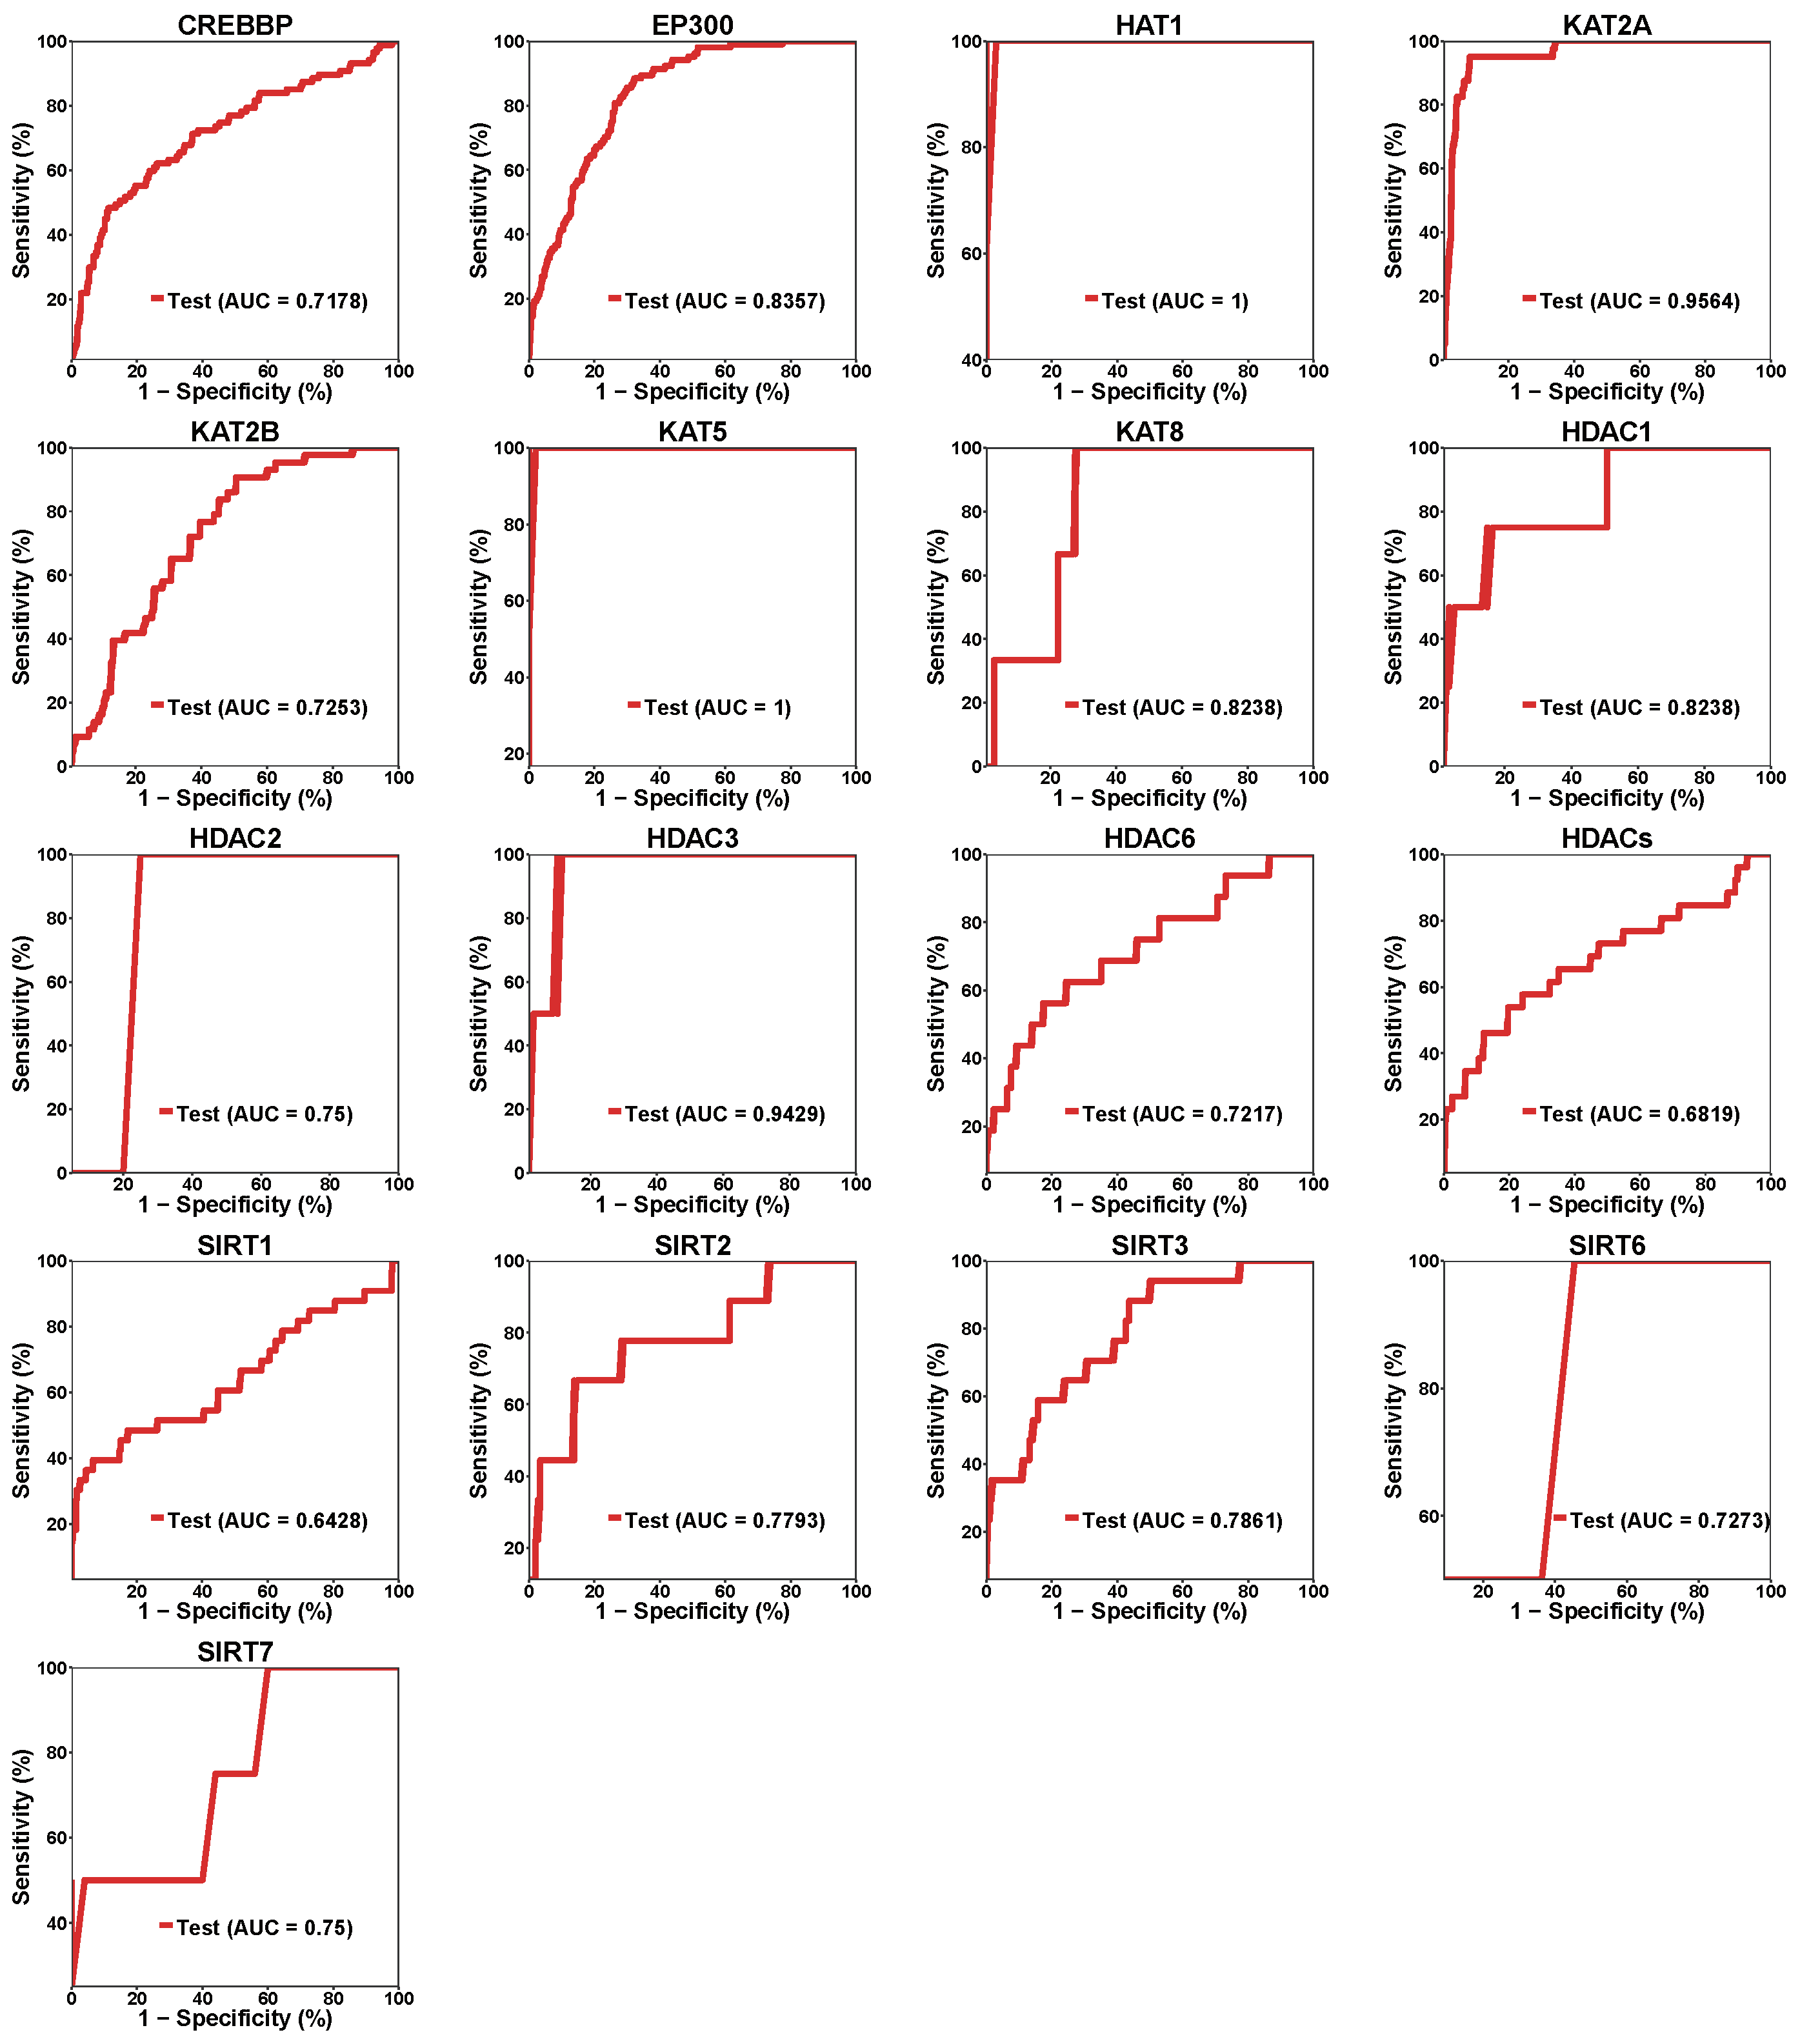
ROC for test validation
Cross validation performance
| Enzyme | Positive | Negative | Threshold | Specificity | Sensitivity | Precision |
|---|
| Enzyme | Positive | Negative | Threshold | Specificity | Sensitivity | Precision |
|---|---|---|---|---|---|---|
| CREBBP | 217 | 2414 | High | 0.9519 | 0.1842 | 0.2298 |
| Medium | 0.9059 | 0.2632 | 0.1786 | |||
| Low | 0.8633 | 0.3958 | 0.2249 | |||
| EP300 | 511 | 4832 | High | 0.9507 | 0.2947 | 0.3691 |
| Medium | 0.9052 | 0.4495 | 0.3500 | |||
| Low | 0.8573 | 0.5229 | 0.2938 | |||
| HAT1 | 12 | 145 | High | 0.9630 | 0.6000 | 0.7500 |
| Medium | 0.9552 | 0.6667 | 0.7067 | |||
| Low | 0.9259 | 0.8000 | 0.6794 | |||
| KAT2A | 40 | 446 | High | 0.9470 | 0.5714 | 0.5170 |
| Medium | 0.8981 | 0.7143 | 0.3841 | |||
| Low | 0.8528 | 0.8571 | 0.3468 | |||
| KAT2B | 108 | 1860 | High | 0.9634 | 0.1600 | 0.2308 |
| Medium | 0.8976 | 0.4211 | 0.2017 | |||
| Low | 0.7646 | 0.4375 | 0.0769 | |||
| KAT5 | 52 | 784 | High | 0.9542 | 0.4667 | 0.5000 |
| Medium | 0.8856 | 0.7333 | 0.3874 | |||
| Low | 0.6830 | 0.8667 | 0.2137 | |||
| KAT8 | 23 | 311 | High | 0.9367 | 0.2857 | 0.4358 |
| Medium | 0.8782 | 0.5000 | 0.3326 | |||
| Low | 0.8475 | 0.6250 | 0.3571 | |||
| HDAC1 | 47 | 827 | High | 0.9649 | 0.4615 | 0.5532 |
| Medium | 0.9199 | 0.5385 | 0.4092 | |||
| Low | 0.8652 | 0.6429 | 0.3253 | |||
| HDAC2 | 28 | 534 | High | 0.9515 | 0.7000 | 0.5916 |
| Medium | 0.8791 | 0.7143 | 0.3375 | |||
| Low | 0.8126 | 0.9167 | 0.4020 | |||
| HDAC3 | 37 | 500 | High | 0.9542 | 0.4444 | 0.5134 |
| Medium | 0.8965 | 0.5556 | 0.3878 | |||
| Low | 0.8053 | 0.6154 | 0.3097 | |||
| HDAC6 | 17 | 365 | High | 0.9348 | 0.3750 | 0.4810 |
| Medium | 0.8116 | 0.6250 | 0.2784 | |||
| Low | 0.5463 | 0.7778 | 0.1792 | |||
| HDACs | 147 | 1738 | High | 0.9405 | 0.7105 | 0.6158 |
| Medium | 0.8958 | 0.7600 | 0.3815 | |||
| Low | 0.8220 | 0.7632 | 0.3292 | |||
| SIRT1 | 185 | 2982 | High | 0.9485 | 0.5143 | 0.3738 |
| Medium | 0.8947 | 0.5806 | 0.2250 | |||
| Low | 0.8692 | 0.6136 | 0.2598 | |||
| SIRT2 | 52 | 733 | High | 0.9607 | 0.2353 | 0.4484 |
| Medium | 0.9235 | 0.3125 | 0.3808 | |||
| Low | 0.8758 | 0.3571 | 0.2543 | |||
| SIRT3 | 30 | 522 | High | 0.9643 | 0.0769 | 0.3397 |
| Medium | 0.9082 | 0.1538 | 0.1849 | |||
| Low | 0.8163 | 0.2308 | 0.1494 | |||
| SIRT6 | 10 | 130 | High | 0.9500 | 0.3750 | 0.7833 |
| Medium | 0.7223 | 0.5000 | 0.2498 | |||
| Low | 0.6400 | 0.6667 | 0.2745 | |||
| SIRT7 | 12 | 279 | High | 0.8269 | 0.1429 | 0.1000 |
| Medium | 0.8173 | 0.2857 | 0.1742 | |||
| Low | 0.7981 | 0.4286 | 0.2225 |
Testing validation performance
| Enzyme | Positive | Negative | Threshold | Specificity | Sensitivity | Precision |
|---|
| Enzyme | Positive | Negative | Threshold | Specificity | Sensitivity | Precision |
|---|---|---|---|---|---|---|
| CREBBP | 87 | 631 | High | 0.9509 | 0.2529 | 0.4151 |
| Medium | 0.9002 | 0.4138 | 0.3636 | |||
| Low | 0.8510 | 0.5057 | 0.3188 | |||
| EP300 | 104 | 876 | High | 0.9509 | 0.2885 | 0.4110 |
| Medium | 0.9007 | 0.4135 | 0.3308 | |||
| Low | 0.8505 | 0.5673 | 0.3105 | |||
| HAT1 | 5 | 33 | High | 0.9697 | 1.0000 | 0.8333 |
| Medium | 0.9091 | 1.0000 | 0.6250 | |||
| Low | 0.8485 | 1.0000 | 0.5000 | |||
| KAT2A | 40 | 466 | High | 0.9506 | 0.8250 | 0.5893 |
| Medium | 0.9013 | 0.9500 | 0.4524 | |||
| Low | 0.8519 | 0.9500 | 0.3551 | |||
| KAT2B | 43 | 192 | High | 0.9531 | 0.0930 | 0.3077 |
| Medium | 0.9010 | 0.1628 | 0.2692 | |||
| Low | 0.8542 | 0.3953 | 0.3778 | |||
| KAT5 | 6 | 47 | High | 0.9574 | 1.0000 | 0.7500 |
| Medium | 0.9149 | 1.0000 | 0.6000 | |||
| Low | 0.8511 | 1.0000 | 0.4615 | |||
| KAT8 | 6 | 174 | High | 0.9540 | 0.3333 | 0.2000 |
| Medium | 0.9023 | 0.3333 | 0.1053 | |||
| Low | 0.8506 | 0.3333 | 0.0714 | |||
| HDAC1 | 4 | 61 | High | 0.9508 | 0.5000 | 0.4000 |
| Medium | 0.9016 | 0.5000 | 0.2500 | |||
| Low | 0.8525 | 0.5000 | 0.1818 | |||
| HDAC2 | 1 | 20 | High | 0.7500 | 1.0000 | 0.1667 |
| Medium | 0.7000 | 1.0000 | 0.1429 | |||
| Low | 0.6500 | 1.0000 | 0.1250 | |||
| HDAC3 | 2 | 70 | High | 0.9571 | 0.5000 | 0.2500 |
| Medium | 0.9000 | 1.0000 | 0.2222 | |||
| Low | 0.8571 | 1.0000 | 0.1667 | |||
| HDAC6 | 16 | 316 | High | 0.9525 | 0.2500 | 0.2105 |
| Medium | 0.9019 | 0.4375 | 0.1842 | |||
| Low | 0.8513 | 0.5000 | 0.1455 | |||
| HDACs | 26 | 549 | High | 0.9508 | 0.2692 | 0.2059 |
| Medium | 0.9016 | 0.3462 | 0.1429 | |||
| Low | 0.8506 | 0.4615 | 0.1277 | |||
| SIRT1 | 33 | 601 | High | 0.9501 | 0.3636 | 0.2857 |
| Medium | 0.9002 | 0.3939 | 0.1781 | |||
| Low | 0.8502 | 0.4242 | 0.1346 | |||
| SIRT2 | 9 | 145 | High | 0.9517 | 0.4444 | 0.3636 |
| Medium | 0.9034 | 0.4444 | 0.2222 | |||
| Low | 0.8552 | 0.6667 | 0.2222 | |||
| SIRT3 | 17 | 190 | High | 0.9526 | 0.3529 | 0.4000 |
| Medium | 0.9000 | 0.3529 | 0.2400 | |||
| Low | 0.8526 | 0.5294 | 0.2432 | |||
| SIRT6 | 2 | 11 | High | 0.9091 | 0.5000 | 0.5000 |
| Medium | 0.8182 | 0.5000 | 0.3333 | |||
| Low | 0.7273 | 0.5000 | 0.2500 | |||
| SIRT7 | 4 | 25 | High | 0.9600 | 0.5000 | 0.6667 |
| Medium | 0.9200 | 0.5000 | 0.5000 | |||
| Low | 0.8400 | 0.5000 | 0.3333 |
Usage procedures
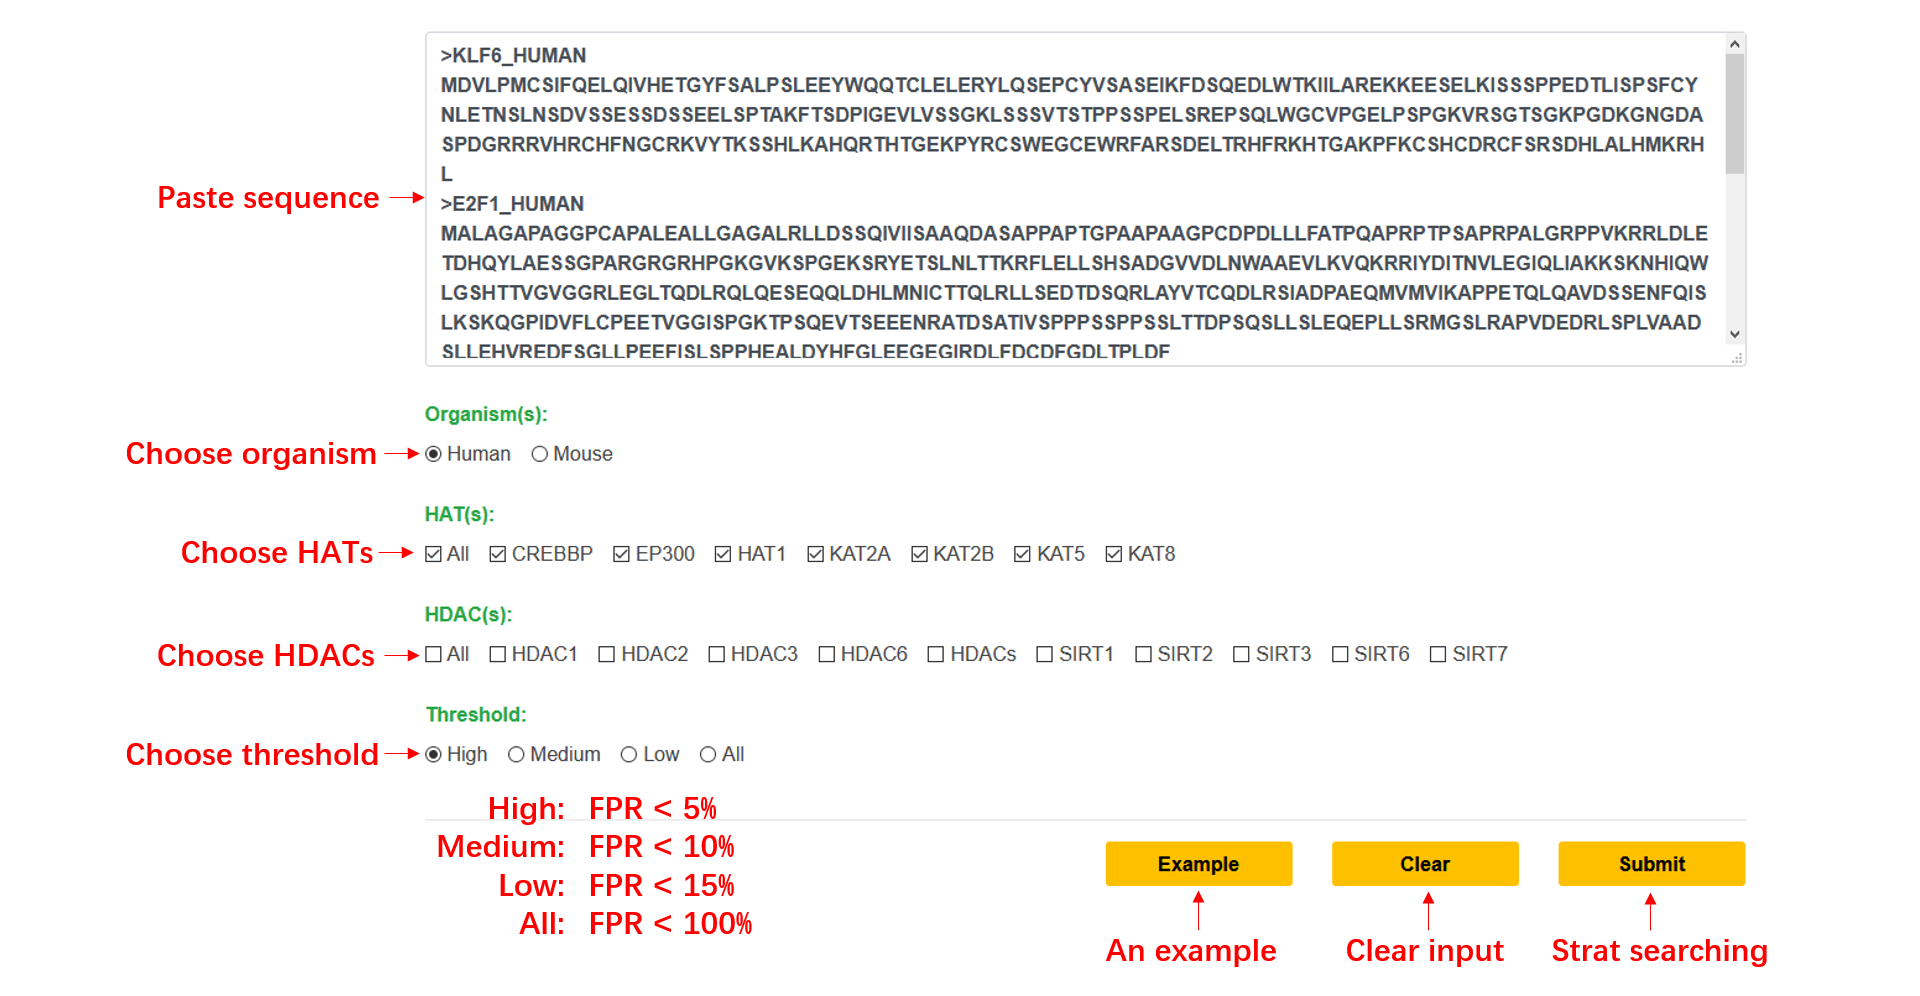
Step1: Paste your FASTA format sequence into the input textarea, or you can click the example button to run the default sequence.
Step2: Choose a kind of enzyme, if ‘All’ is selected, all enzymes will be predicted.
Step3: Choose a threshold to get a high confidence result, the default value is ‘Medium’.
Step4: Click Submit.
Output result explanation
Potential HAT(s)/HDAC(s) modification site(s)
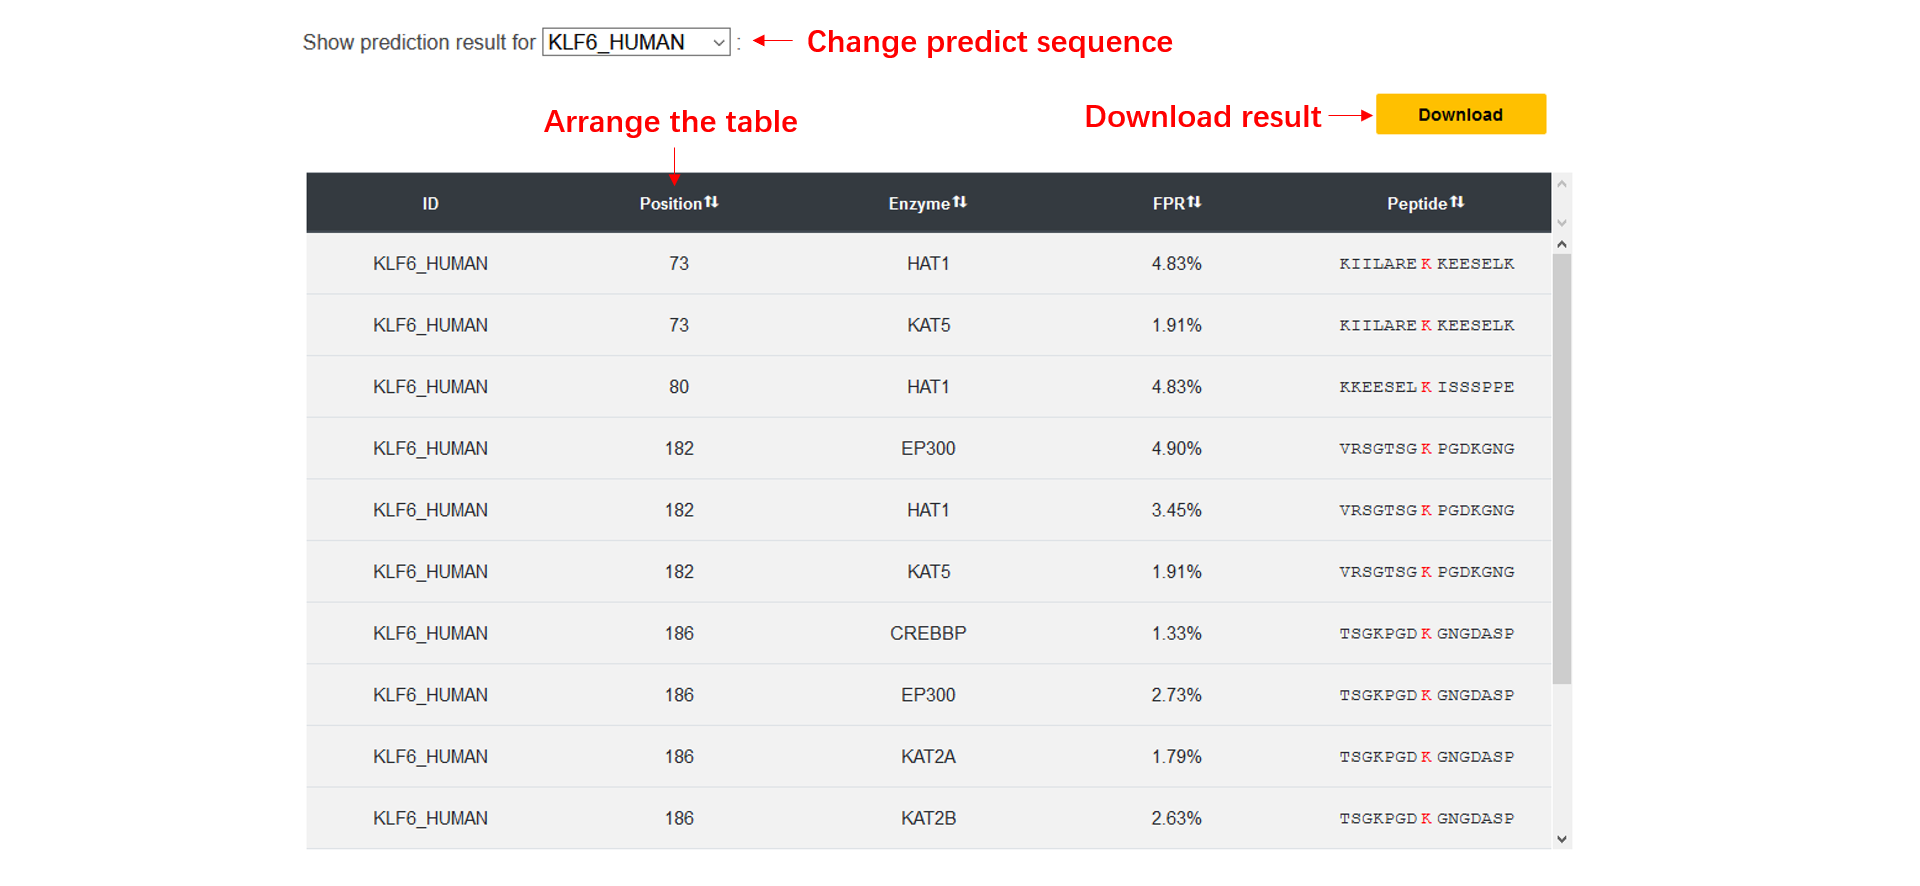
This table contains five column, including FASTA title ID, position, enzyme, FPR (false positive rate) and the peptide sequence window.
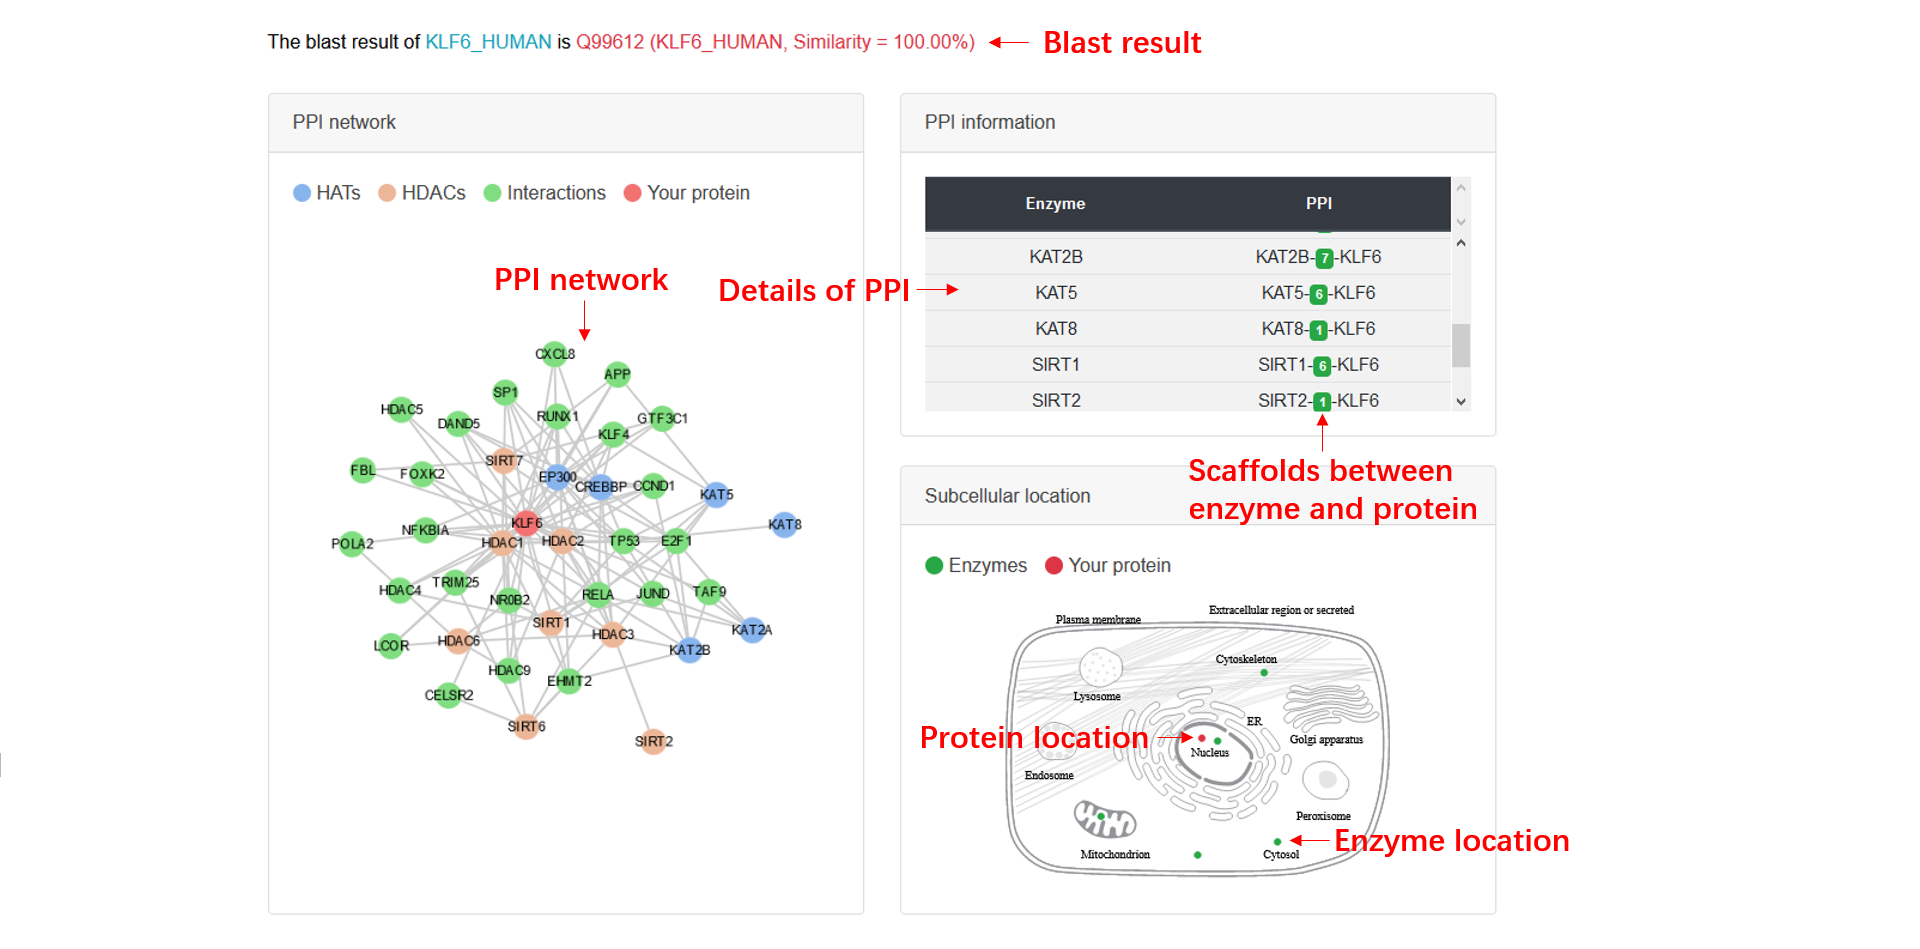
Network and colocalization
The PPI data are collected from several databases, the blue nodes are the HATs, while the orange nodes are the HDACs, the red node is the protein that matches query sequence best and green nodes are scaffolds.
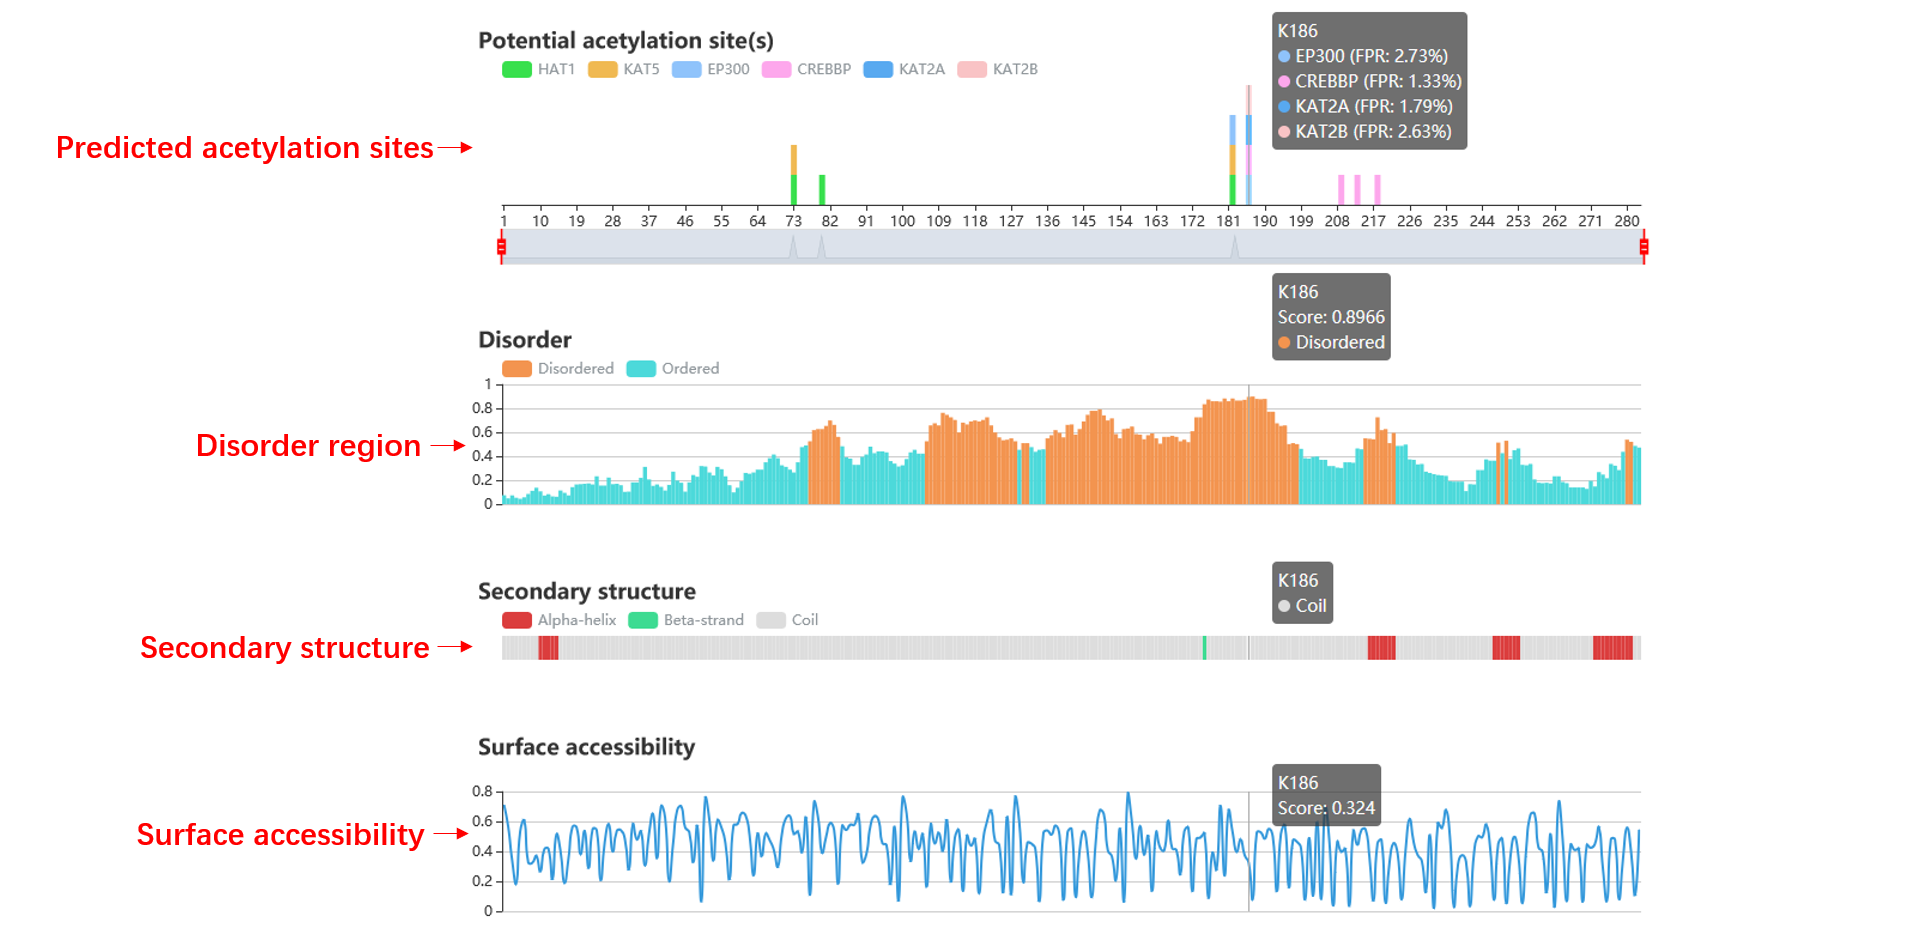
Secondary structure and surface accessibility
The disorder values are calculated by IUPred. The surface accessibility and secondary structure information are predicted by NetSurfP. By the way, the predicted acetylation and deacetylation sites are labeled.
